Data Sheets Page This is the Primary Server
South-East Aminster Environmental and Weather Observations
Latitude 50'44'21.6"N Longitude 2'52'36.6"W | Altitude: 33m above sea level
Information referenced in this page and on this site are taken from the below links:
Oxygen (O₂) and Nitrogen (N₂) Levels and Their Impact on Life
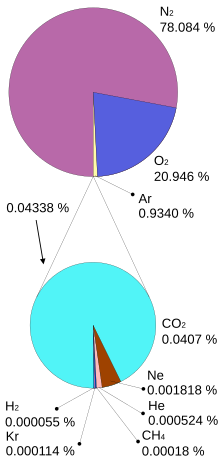
Oxygen (O₂) and nitrogen (N₂) levels in the atmosphere are critical to maintaining life. Here's what happens when these levels deviate significantly from their normal concentrations:
Oxygen (O₂) Levels:
- Normal Atmospheric Oxygen Level: About 21% of the Earth's atmosphere.
- Dangerous Levels:
- 19.5%: OSHA defines oxygen-deficient atmospheres as having less than 19.5% oxygen. Symptoms like impaired thinking and coordination may begin to occur.
- 15-19%: Reduced physical and intellectual performance without any significant discomfort. However, prolonged exposure can be harmful.
- 12-15%: Increased breathing rate, accelerated heartbeat, impaired attention and coordination, headaches, dizziness, and fatigue.
- 10-12%: Further deterioration of coordination, weakness, nausea, and vomiting.
- 6-10%: Very low oxygen levels can lead to unconsciousness within minutes, followed by respiratory and cardiac arrest, and death if not quickly reversed.
- <6%: Immediate unconsciousness, followed by death within a few minutes.
Nitrogen (N₂) Levels:
- Normal Atmospheric Nitrogen Level: About 78% of the Earth's atmosphere.
- Dangerous Levels:
- Increased Nitrogen Concentration: Nitrogen itself is not toxic, but an increase in nitrogen concentration would reduce the oxygen concentration, leading to oxygen deprivation (hypoxia). If nitrogen levels were to increase significantly and oxygen levels drop below 19.5%, the same dangers listed above for oxygen deficiency would apply.
- Near 100% Nitrogen: This would effectively eliminate oxygen from the air, leading to unconsciousness and death within minutes due to lack of oxygen.
Conclusion:
- Oxygen (O₂): Levels below 19.5% are considered unsafe and potentially life-threatening, with levels below 6% leading to rapid unconsciousness and death.
- Nitrogen (N₂): Although not directly harmful, elevated nitrogen levels that reduce oxygen concentrations below safe levels pose a significant threat to life.
Maintaining the balance of oxygen and nitrogen in the atmosphere is crucial for sustaining life as we know it. Any significant deviation from these levels can have serious, and often fatal, consequences.
Oxygen (O₂) and Nitrogen (N₂) Levels and Their Impact on Life
Oxygen (O₂) and nitrogen (N₂) levels in the atmosphere are critical to maintaining life. Here's what happens when these levels deviate significantly from their normal concentrations:
Oxygen (O₂) Levels:
- Normal Atmospheric Oxygen Level: About 21% of the Earth's atmosphere.
- Dangerous Levels:
- 19.5%: OSHA defines oxygen-deficient atmospheres as having less than 19.5% oxygen. Symptoms like impaired thinking and coordination may begin to occur.
- 15-19%: Reduced physical and intellectual performance without any significant discomfort. However, prolonged exposure can be harmful.
- 12-15%: Increased breathing rate, accelerated heartbeat, impaired attention and coordination, headaches, dizziness, and fatigue.
- 10-12%: Further deterioration of coordination, weakness, nausea, and vomiting.
- 6-10%: Very low oxygen levels can lead to unconsciousness within minutes, followed by respiratory and cardiac arrest, and death if not quickly reversed.
- <6%: Immediate unconsciousness, followed by death within a few minutes.
Nitrogen (N₂) Levels:
- Normal Atmospheric Nitrogen Level: About 78% of the Earth's atmosphere.
- Dangerous Levels:
- Increased Nitrogen Concentration: Nitrogen itself is not toxic, but an increase in nitrogen concentration would reduce the oxygen concentration, leading to oxygen deprivation (hypoxia). If nitrogen levels were to increase significantly and oxygen levels drop below 19.5%, the same dangers listed above for oxygen deficiency would apply.
- Near 100% Nitrogen: This would effectively eliminate oxygen from the air, leading to unconsciousness and death within minutes due to lack of oxygen.
Conclusion:
- Oxygen (O₂): Levels below 19.5% are considered unsafe and potentially life-threatening, with levels below 6% leading to rapid unconsciousness and death.
- Nitrogen (N₂): Although not directly harmful, elevated nitrogen levels that reduce oxygen concentrations below safe levels pose a significant threat to life.
Maintaining the balance of oxygen and nitrogen in the atmosphere is crucial for sustaining life as we know it. Any significant deviation from these levels can have serious, and often fatal, consequences.
Safe UV Exposure Levels
UV Index 0 to 2 (Low): Safe for most individuals. Recommended to wear sunglasses on bright days.
UV Index 3 to 5 (Moderate): Seek shade during midday hours, cover up, and wear sunscreen.
UV Index 6 to 7 (High): Reduce exposure by seeking shade during late morning through mid-afternoon. Wear protective clothing and sunscreen.
UV Index 8 to 10 (Very High): Minimize sun exposure between 10 a.m. and 4 p.m. Apply SPF 30+ sunscreen, wear a hat and sunglasses, and cover up.
UV Index 11+ (Extreme): Avoid sun exposure between 10 a.m. and 4 p.m. Strictly apply protective measures: SPF 30+ sunscreen, sunglasses, and protective clothing.
UV at Night
It is all so possible to experience UV radiation even at night, though the intensity is much lower than during the day.
Moonlight, for example, contains a small amount of UV radiation.
Additionally, atmospheric UV radiation from cosmic rays and other sources can persist even during the nighttime.
Here's a more detailed explanation:
Moonlight: Moonlight, while mainly visible light, does contain a small portion of UV radiation.
Atmospheric UV: Even on moonless, overcast nights, there is still UV radiation exposure. This is primarily due to nitrogen fluorescence from high-energy charged particles, including cosmic rays.
UV Index at Night: The UV Index, which measures the intensity of UV radiation, can range from 0 (nighttime) to 15 or 16 (in the tropics at high elevations under clear skies). While it's lower at night, it's not necessarily zero.
Cosmic Rays: Cosmic rays, which are high-energy charged particles, interact with the atmosphere, producing UV radiation
It's important to check the local UV Index forecast to plan outdoor activities safely and reduce the risk of UV-related skin and eye damage.
The UV sensor used in this station measures UV radiation in the wavelength range of 200-370nm, covering UV-A, UV-B, and part of the UV-C spectrum. For more information on UV wavelengths, refer to EPA UV Radiation.
Beaufort Wind Scale
0 --- Calm: less than 1 mph (0 m/s) | Smoke rises vertically
1 --- Light air: 1 - 3 mph (0.5-1.5 m/s) | Smoke drifts with air, weather vanes inactive
2 --- Light breeze: 4 - 7 mph (2-3 m/s) | Weather vanes active, wind felt on face, leaves rustle
3 --- Gentle breeze: 8 - 12 mph (3.5-5 m/s) | Leaves & small twigs move, light flags extend
4 --- Moderate breeze: 13 - 18 mph (5.5-8 m/s) | Small branches sway, dust & loose paper blows about
5 --- Fresh breeze: 19 - 24 mph (8.5-10.5 m/s) | Small trees sway, waves break on inland waters
6 --- Strong breeze: 25 - 31 mph (11-13.5 m/s) | Large branches sway, umbrellas difficult to use
7 --- Moderate gale: 32 - 38 mph (14-16.5 m/s) | Whole trees sway, difficult to walk against wind
8 --- Fresh gale: 39 - 46 mph (17-20 m/s) | Twigs broken off trees, walking against wind very difficult
9 --- Strong gale: 47 - 54 mph (20.5-23.5 m/s) | Slight damage to buildings, shingles blown off roof
10 -- Whole gale: 55 - 63 mph (24-27.5 m/s) | Trees uprooted, considerable damage to buildings
11 -- Storm: 64 - 73 mph (28-31.5 m/s) | Widespread damage, very rare occurrence
12 -- Hurricane: over 73 mph (over 32 m/s) | Violent destruction
Pollen Levels
The Met Office uses the following scale for pollen levels:
Low (0 - 30 grains/m³ ): Minimal to no impact on individuals with pollen allergies.
Moderate (31 - 60 grains/m³ ): May cause mild symptoms in individuals with pollen allergies.
High (61 - 150 grains/m³ ): Likely to cause moderate to severe symptoms in individuals with pollen allergies.
Very High (151+ grains/m³ ): Expected to cause severe symptoms and may affect individuals without known pollen allergies.
It's important to check daily pollen forecasts, especially during the pollen season, to manage allergies effectively. For more information, refer to the Met Office Pollen Forecast.
The PM2.5 sensor used in this station is capable of detecting fine particulate matter, including pollen particles, providing real-time data on air quality and pollen status. This helps in assessing the current pollen levels and understanding their potential impact on health.
The UK follows the EU's annual mean limit of 25 µg/m³ for PM2.5 and 40 µg/m³ for PM10.
Air Quality Index (AQI)
The Air Quality Index (AQI) is a standardized measure used to communicate how clean or polluted the air is, and what health effects may be a concern for the public.
Good (0 – 50): Air quality is considered satisfactory, and air pollution poses little or no risk.
Moderate (51 – 100): Acceptable air quality; however, some pollutants may affect a very small number of sensitive individuals.
Unhealthy for Sensitive Groups (101 – 150): Members of sensitive groups may experience health effects. The general public is unlikely to be affected.
Unhealthy (151 – 200): Everyone may begin to experience health effects; sensitive groups may experience more serious effects.
Very Unhealthy (201 – 300): Health alert: everyone may experience more serious health effects.
Hazardous (301 – 500): Health warnings of emergency conditions. The entire population is more likely to be affected.
AQI is primarily based on levels of key pollutants such as PM2.5, PM10, ozone (O₃), nitrogen dioxide (NO₂), carbon monoxide (CO), and sulfur dioxide (SO₂).
This weather station uses a PM2.5 sensor capable of detecting fine particulate matter, helping provide real-time air quality updates. PM2.5 particles are particularly harmful because they can penetrate deep into the lungs and even enter the bloodstream.
To learn more about the AQI and your area's current readings, visit the UK-AIR DEFRA website.
Radiation Detection and Safety Levels
The J305 radiation detector used in this station is capable of detecting background radiation levels, including possible radon gas detection. This detector provides valuable data to assess radiation exposure and ensure safety.
Background Radiation Levels
Background radiation typically includes natural sources such as cosmic rays, terrestrial radiation from soil and rocks, and small amounts from human activities. The average background radiation level is about 2-3 millisieverts (mSv) per year.
Acceptable Radiation Levels
According to the International Commission on Radiological Protection (ICRP), the recommended limit for radiation exposure for the general public is 1 mSv per year, excluding natural background and medical exposures. For radiation workers, the limit is 20 mSv per year averaged over five years, with no more than 50 mSv in any single year.
Radon Gas Detection
Radon is a naturally occurring radioactive gas that can accumulate in buildings, particularly in basements and lower floors. Prolonged exposure to high levels of radon can increase the risk of lung cancer. The J305 detector can measure radon levels, providing important data to mitigate potential health risks.
Equivalent Doses
The equivalent dose is a measure of the biological effect of radiation exposure, accounting for the type of radiation and its impact on different tissues. It is measured in sieverts (Sv). For instance, an equivalent dose from radon exposure is considered concerning if it exceeds 100 Bq/m³ (becquerels per cubic meter) over a long period.
For more information on radiation safety and acceptable levels, refer to the World Health Organization (WHO) Radon and Health website.
Acceptable Gas PPM Levels
| Gas | Acceptable PPM |
|---|---|
| Hexane | Long-term exposure limit (LTEL): 72 mg/m³ or approximately 20 ppm over an 8-hour time-weighted average. |
| Toluene | Toluene and other VOCs do not have specific background levels but are generally monitored as part of indoor air quality assessments. |
| Benzene | For benzene, the UK standard is an annual average of 5 µg/m³ (about 0.002 ppm). |
| Propane | The primary concern with propane is its lower explosive limit (LEL), which is 2.1% by volume in air, equivalent to 21,000 ppm. This indicates the lowest concentration of propane in air that can ignite if an ignition source is present. |
| Methane | As a primary component of natural gas, methane in an outdoor environment typically has a background level of about 1.8 ppm. Methane is not typically a concern indoors unless there is a gas leak. |
| Carbon Dioxide | In outdoor air, typical background levels are about 400 ppm. Indoor levels vary but usually should be below 1,000 ppm to maintain good air quality. |
| Ammonia | Short-term exposure limit (STEL): 35 ppm (parts per million) over a 15-minute period. Long-term exposure limit (LTEL): 25 ppm over an 8-hour time-weighted average. |
| Acetone | Short-term exposure limit (STEL): 1500 ppm (parts per million) over a 15-minute period. Long-term exposure limit (LTEL): 500 ppm over an 8-hour time-weighted average. |
| Carbon Monoxide | For indoor air, the WHO guideline value is 7 mg/m³ (about 6 ppm) for a 24-hour period. |
| Hydrogen | Lower Explosive Limit (LEL): Approximately 4% (40,000 ppm) in air. Upper Explosive Limit (UEL): Approximately 75% (750,000 ppm) in air. |
| Ozone | Background levels in rural areas can vary, with average concentrations around 30-50 ppb (about 0.030-0.050 ppm). The UK's objective for maximum daily 8-hour mean is 100 µg/m³ (about 0.050 ppm). |
| Nitrogen Dioxide | The UK's Air Quality Standards Regulations 2010 prescribe an annual mean limit of 40 µg/m³ (about 0.021 ppm) for NO2. |
| Chlorine | Short-term exposure limit (STEL): 1.5 ppm (parts per million) over 15 minutes. Long-term exposure limit (LTEL): 0.5 ppm over 8 hours. |
| LPG | The LEL for propane, a major component of LPG, is about 2.1% by volume in air, or 21,000 ppm, and the UEL is about 9.5% by volume, or 95,000 ppm. These values indicate the gas concentrations between which propane can ignite if there is an ignition source |
| Hydrogen Sulfide | The UK's Air Quality Standards Regulations set a 1-hour mean concentration limit of 350 µg/m³ (about 0.131 ppm) not to be exceeded more than 24 times a year. |
| Oxygen | Oxygen (O2) in ambient air is essential for human life, and its concentration is typically around 20.9% by volume under standard conditions. Unlike contaminants, where permissible exposure limits (PELs) or maximum allowable concentrations are specified to protect against harmful effects, the concern with oxygen revolves around maintaining its concentration within a safe and breathable range. For Oxygen, the acceptable range in occupational settings is generally as follows: Minimum acceptable concentration: About 19.5% by volume Maximum safe concentration: Up to about 23.5% by volume Oxygen levels below 19.5% can lead to hypoxia, affecting cognitive and physical performance, and posing a risk of unconsciousness or death in severe cases. Conversely, environments with oxygen levels above 23.5% increase the risk of fire and explosion because oxygen supports combustion. Therefore, controlling oxygen levels is crucial in enclosed spaces, such as confined work areas or during operations involving inert gases, to ensure safety and health. |
Understanding Magnetic Flux and Its Role in Earth Systems
What is Magnetic Flux?
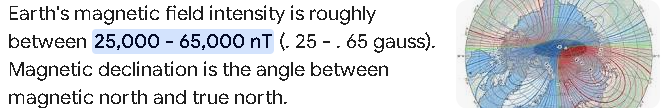
Magnetic flux is a measure of the strength and direction of a magnetic field passing through a given area. It is an essential concept in electromagnetism, typically represented in Webers (Wb). Earth's magnetic field originates from molten iron movements within the planet's outer core and extends thousands of kilometers into space.
Why Does Magnetic Flux Matter?
Magnetic flux plays a vital role in shielding the planet from harmful solar and cosmic radiation. It protects life on Earth by deflecting charged particles from the Sun (solar wind), reducing exposure to harmful ionizing radiation. Without this magnetic shield—often referred to as the magnetosphere—Earth's atmosphere could be stripped away over time, similar to what is believed to have happened on Mars.
How Do We Rely on It?
- Navigation: Magnetic flux variations are critical for compass-based navigation and are also used in modern GPS satellite correction models.
- Animal Migration: Many species, including birds and sea turtles, rely on Earth's magnetic field for long-distance orientation and migration patterns.
- Power Grids and Satellites: Changes in geomagnetic flux (especially during geomagnetic storms) can induce currents in power lines, potentially disrupting electrical infrastructure and satellite communication.
- Monitoring Space Weather: Agencies like NOAA monitor real-time magnetic flux to issue alerts for geomagnetic storms, which can affect aviation, navigation systems, and even astronaut safety.
Monitoring magnetic flux helps us prepare for space weather events and maintain stable infrastructure on Earth. The image below, sourced from NOAA, shows global variations in magnetic field strength, helping track disturbances caused by solar activity.
Information provided on this website is for informational purposes only and holds no scientific grounding or basis for public awareness and advice. Please seek guidance from your local government or necessary authoritative information provider.
Click the buttons below to access the pages:
Information links below for data collected via stations sensors: